Description
Companions are important. Fortunately, Arometrix’s suite of technologies now has one — a companion data review app!
The Data Analysis Breakdown (DAB) App is our new computer application for users to easily upload & review logged Arometrix run data after your process.
Note: The app is currently in Beta and we appreciate any and all feedback.
Dive deep into your molecular process data in hindsight for the first-time ever!
Quick Informative Videos
Video on How to Record & Export Run Data (Watch Now!)
- Learn how to log run data on Arometrix’s digital display
- Learn how to capture run data on a USB thumb drive
Video on How to Use the App (Watch Now!)
- Watch how to navigate between plots and how they interact with each other
- Watch how some of the more prominent features work
DON’T JUST DO YOUR PROCESS. KNOW YOUR PROCESS.
Features & Details
Arometrix run data review
- Upload your Fraction Finder run data into the DAB App
- Review your entire Fraction Finder run set as a heat map / 2D Plot (NEW)
- Review your entire Fraction Finder run set on our Wavelength Plot
- Review any recorded spectra on its a Spectrum Plot
- Select any molecule to populate all plots with a highlight of where its fluorescence region is
- Select any combination of spectra and region via an interactive plot
Take a look at some screenshots below.
___
Here’s a preview
Run Example: Delta-9 Short Path Distillation Run
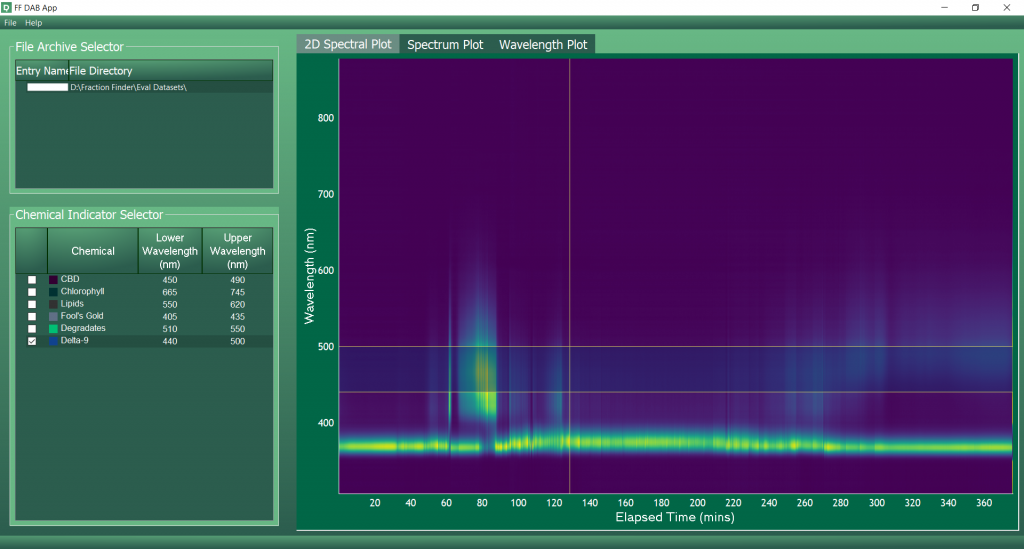
2D Spectral Plot Example #1: This 2D Spectral (heat) Plot shows the entire Delta-9 distillation run in one graph, tracking wavelength over time. Notice that only Delta-9 is checked off on the left-hand side, which highlights its wavelength region on the plot.
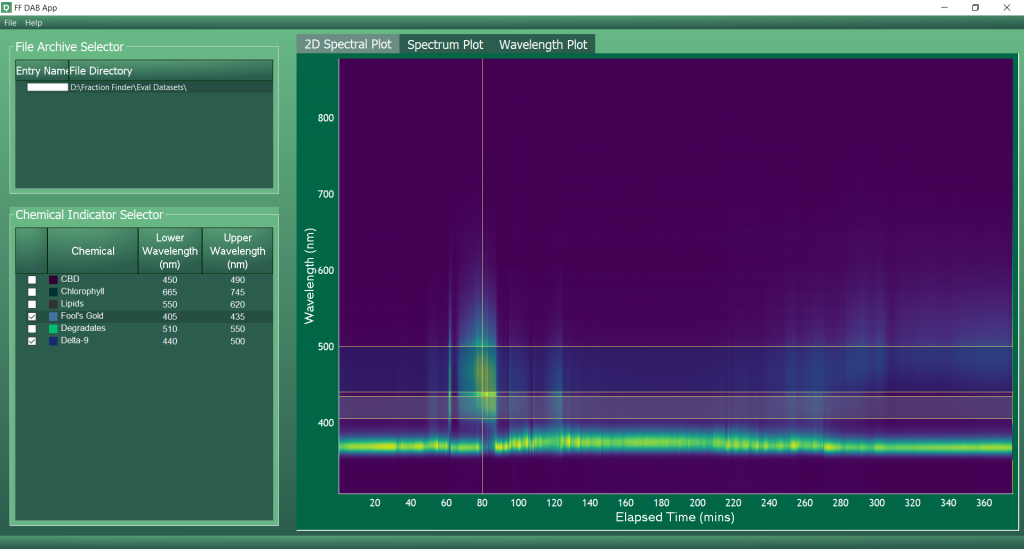
2D Spectral Plot Example #2: This 2D Spectral (heat) Plot shows the entire Delta-9 distillation run in one graph, tracking wavelength over time. Notice that Delta-9 and “Fool’s Gold” are both checked off on the left-hand side, which highlights its wavelength region on the plot.
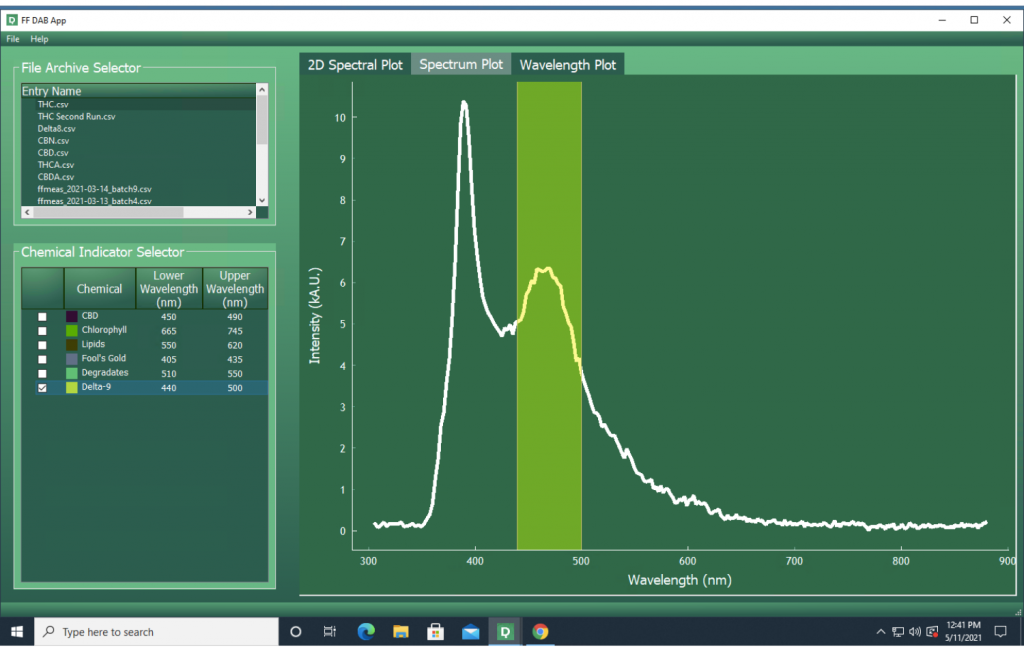
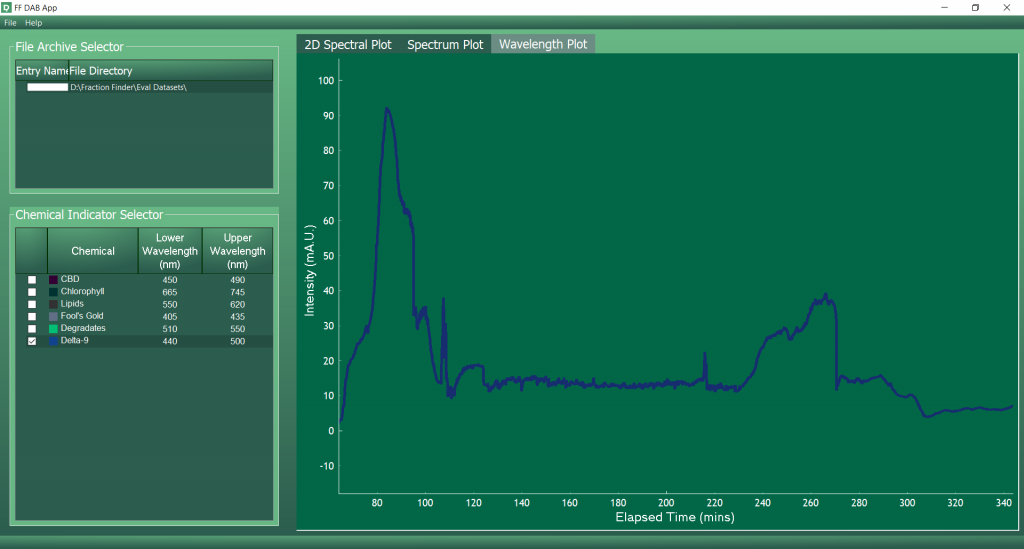
Wavelength Plot Example: This Wavelength Plot also shows the entire Delta-9 distillation run in one graph, tracking spectral Intensity over time. Notice that only Delta-9 is checked off on the left-hand side, which highlights its wavelength intensity throughout the entire run on the plot.
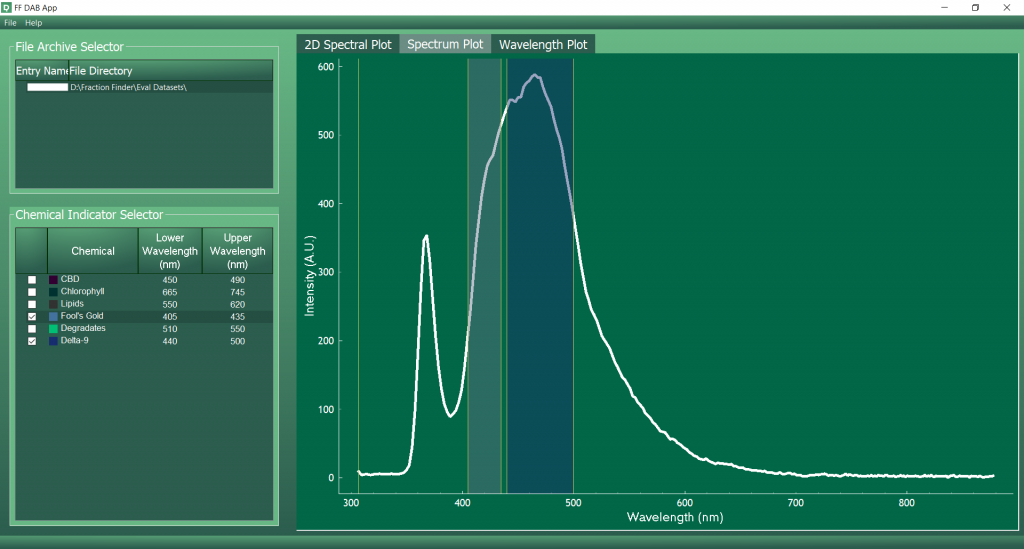
Spectrum Plot Example #1: This Spectrum Plot shows one moment of the Delta-9 distillation run in one graph, tracking spectral Intensity over Wavelength. Notice that only Delta-9 is checked off on the left-hand side, which highlights its wavelength region on the plot.
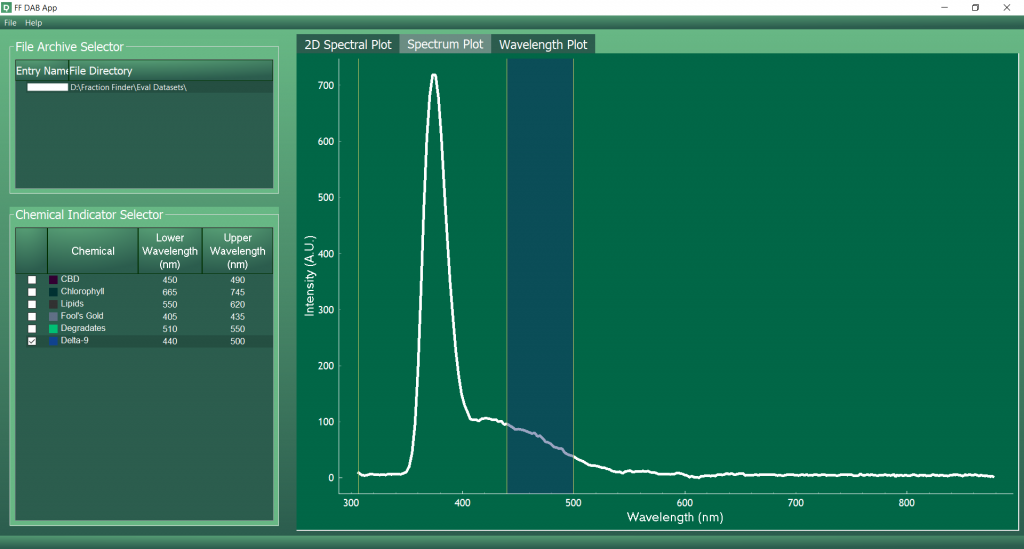
Spectrum Plot Example #2: This Spectrum Plot shows one moment of the Delta-9 distillation run in one graph, tracking spectral Intensity over Wavelength. Notice that both Delta-9 and “Fool’s Gold” are checked off on the left-hand side, which highlights its wavelength region on the plot.